Crypto
12 Mar 2026
Read 10 min
Can XRP hit $42 2026 Discover 5 signs to watch *
Can XRP hit $42 2026, learn five technical signs and clear price levels that signal a sustained rally
XRP trades in a tight range near $1.30–$1.40 as traders debate the next move. Can XRP hit $42 2026 depends on five clear signs: key breakout levels, stronger ETF inflows, real bank usage of XRP for settlement, lighter sell walls, and a healthy macro backdrop led by Bitcoin.
XRP has teased big breakouts before, then cooled for months. Today, price sits on a key retest after a 2025 rally to $3.65. One analyst, EGRAG CRYPTO, sees a path to $42 if the current structure repeats the same rhythm that drove three past cycles. That is a bold number. The math and milestones matter more than the hype.
Can XRP hit $42 2026: the setup and the math
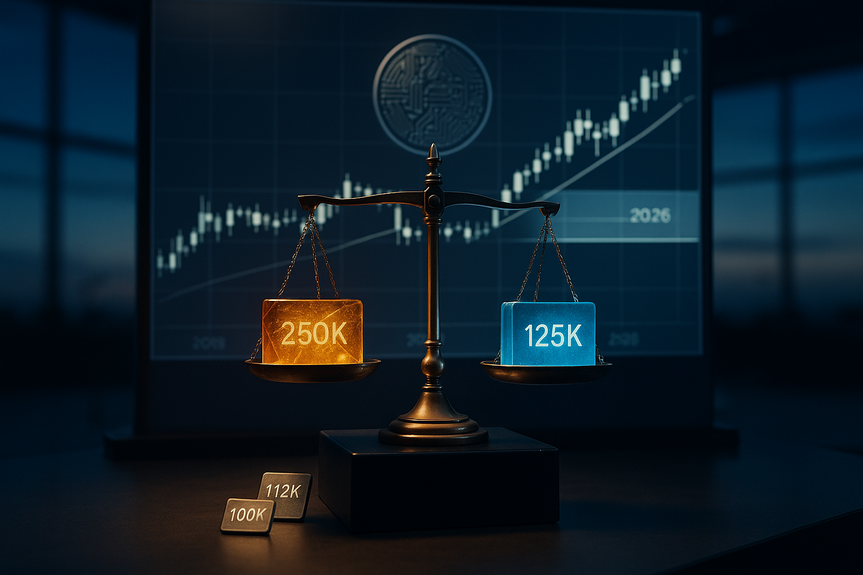
EGRAG’s view comes from four large structures on the monthly chart since 2014. Each one followed a pattern: a long squeeze into a tight range, a sharp breakout, an expansion rally, and a reset. The fourth started at the June 2020 low near $0.17, pushed to $1.96 in 2021, then chopped around $0.50 for years before breaking a long downtrend in late 2024 and topping at $3.65 in July 2025. Price has since pulled back to retest the breakout zone near $1.30–$1.40. EGRAG’s ladder is not “$42 or bust.” His staged targets are: – $4.50 if the breakout confirms – $10–$13 if expansion follows – $23–$27 at a potential cycle peak – $42 as the most aggressive extension The numbers demand context. With roughly 61 billion XRP in circulation, $42 implies a market cap near $2.56 trillion. That would be bigger than the entire crypto market’s current value. For that to happen by 2026, XRP would need to dominate global cross-border settlement, not just sit as a part-time bridge asset. Many banks on RippleNet still use messaging tools without settling in XRP. Ripple also promotes RLUSD, its stablecoin, which reduces volatility risk for banks and competes with XRP’s role. So when people ask, Can XRP hit $42 2026, they should start with the math. The average of EGRAG’s four scenarios is closer to $11, which is ambitious yet within reach for a top-three coin during a strong bull cycle.The four XRP cycles in plain language
2014–2016: Tiny range, tiny spikes
Price jumped from $0.0046 to $0.028 in late 2014, then sat between $0.006 and $0.009 for years.2017: First major breakout
XRP broke the range in March 2017, ran to $0.40 by May, then paused. A second wave sent it to $3.31 in January 2018.2018–2020: Long decline and reset
A two-and-a-half-year drop found a floor near $0.17 by June 2020.2020–2025: New structure, new test
Price pushed to $1.96 in 2021, churned around $0.50 for years, broke a long downtrend in late 2024, and topped at $3.65 in July 2025. It now retests the breakout near $1.30–$1.40. If the rhythm repeats at similar proportions, the upside can be large. But repeating a pattern does not guarantee the same size of move.5 signs to watch before calling the moonshot
- A weekly close above $1.55. This weakens the descending channel from the July 2025 peak and shows buyers have control again.
- A strong break and hold above $2.20–$2.30. That level rejected price near $2.40 in January and marks the line between a range and a new trend toward $2.70–$3.60.
- Spot ETF strength and Bitcoin leadership. Net ETF inflows above $5 billion and Bitcoin steady above $80,000 would fuel risk appetite and help altcoins, including XRP.
- Real bank settlement using XRP. Beyond RippleNet messaging, watch for on-ledger settlement volume and public corridors moving serious size through XRP instead of stablecoins like RLUSD.
- Overhead supply gets absorbed. About 1.85 billion XRP clustered around $1.76–$1.80. Cleanly absorbing that sell wall signals stronger market depth and less friction on rallies.
What realistic 2026 ranges look like
Base case: $3–$5
If ETF inflows remain steady and macro stays calm, XRP likely trades within the consensus range most analysts expect. EGRAG’s $4.50 checkpoint sits right in the middle of that band. This path needs modest altcoin rotation, a friendly risk tone, and steady liquidity.Bull case: $10–$27
This range needs confirmation of a new all-time high above $3.65. Fuel it with: – Strong spot ETF inflows that exceed $5 billion – At least one major bank settling payments with XRP, not just testing it – Bitcoin holding high ground to keep momentum alive Hit those marks and $10–$13 becomes a reasonable milestone, with a stretch to $23–$27 possible at a cycle peak.Bear case: $1–$2
A weekly breakdown below $1.10 would damage the long-term uptrend from 2015 and likely reset the whole pattern. That could happen if ETF flows flip negative, Bitcoin loses key support, or U.S. policy momentum stalls. In that case, retests toward the $1.16 February low are on the table.How to read the next few months
Levels drive the story
– First, watch $1.55. A weekly close above it suggests the downtrend is fading. – Next, watch $2.20–$2.30. A close over that range invalidates the bearish setup and opens $2.70–$3.60.Liquidity is the fuel
ETF demand, market depth, and tight spreads help rallies hold. If sell walls at $1.76–$1.80 thin out, the path higher gets smoother.Utility must grow
The big number needs real use. Cross-border payments that settle in XRP, not just route messages through RippleNet, are the proof. Keep an eye on public corridor data, partner updates, and any shift away from stablecoins for settlement.Bottom line
EGRAG’s structure has matched three past XRP cycles and sets clear targets: $4.50 first, then $10–$13, with $23–$27 at a likely peak. The outlier is $42, which would require a market cap above $2.5 trillion and a major shift in global payments. Before you ask again, Can XRP hit $42 2026, watch the milestones: $1.55, $2.20–$2.30, ETF inflows, real settlement, and supply absorption. If those align, the upside case builds. If they do not, the base range near $3–$5 remains the smarter expectation.For more news: Click Here
FAQ
Q: Can XRP hit $42 2026?
A: EGRAG CRYPTO lays out a path to $42 based on repeating monthly-chart structures but calls $42 the most aggressive extension rather than the most likely outcome. Reaching $42 would imply a market cap near $2.56 trillion and require XRP to dominate global cross-border settlement rather than the limited usage seen today.
Q: What specific signs should be present before calling a $42 run for XRP?
A: The article lists five signs: a weekly close above $1.55, a sustained break and hold above $2.20–$2.30, significant spot ETF inflows (net inflows above $5 billion), real bank settlement activity using XRP rather than just RippleNet messaging, and absorption of overhead supply clustered near $1.76–$1.80. Several of these signals would need to align simultaneously before the $42 scenario becomes plausible.
Q: How does EGRAG build the $42 projection and what are the staged targets?
A: EGRAG builds the projection from four macro formations on XRP’s monthly chart since 2014 that compress, breakout, expand, and reset, and he sets staged targets of $4.50, $10–$13, $23–$27 and $42 as an extreme. His average across the four scenarios comes out to about $11, indicating $42 is an outlier rather than his baseline forecast.
Q: What would a $42 XRP mean for market capitalization and why is that significant?
A: With roughly 61 billion XRP in circulation, a $42 price implies a market cap near $2.56 trillion, which the article notes would exceed the current entire crypto market valuation of about $2.3 trillion. That significance is that XRP would need to be worth more than Bitcoin, Ethereum, and every other cryptocurrency combined to justify $42.
Q: What are the base, bull, and bear 2026 price scenarios for XRP described in the article?
A: The article’s base case is roughly $3–$5 by late 2026 if ETF inflows continue steadily and macro conditions stay calm, the bull case is $10–$27 if XRP confirms a new all-time high and sees strong ETF inflows plus bank settlement adoption, and the bear case is $1–$2 if price breaks below $1.10 and the long-term uptrend fails. The bull path specifically cites needs like ETF inflows exceeding $5 billion, at least one major bank settling through XRP, and Bitcoin holding above $80,000.
Q: Which technical levels should traders watch in the near term to know whether a new rally is starting?
A: The article highlights a weekly close above $1.55 as the first sign the descending channel is weakening and a clear close above $2.20–$2.30 as the next level that would invalidate the bearish structure and open $2.70–$3.60. Traders should also monitor whether roughly 1.85 billion XRP accumulated around $1.76–$1.80 is absorbed, since that overhead supply could impede rallies.
Q: How important are ETF inflows and Bitcoin’s performance to the $42 thesis?
A: ETF inflows and Bitcoin leadership are presented as central to the higher targets, with net ETF inflows above $5 billion and Bitcoin holding high ground (the article cites $80,000) helping fuel altcoin demand and support moves toward the $10–$27 zone or higher. Without significant ETF demand and Bitcoin strength, the article suggests XRP is more likely to remain in the base band or move toward bearish outcomes.
Q: If the key milestones fail to materialize, what does the article say investors should expect instead of a $42 outcome?
A: If the milestones fail to materialize, the article recommends a smarter expectation is the base $3–$5 range for 2026 under steady liquidity and macro stability, while a weekly breakdown below $1.10 would invalidate the bullish structure and could send XRP toward a $1–$2 bear range. The article emphasizes watching the $1.55 and $2.20–$2.30 levels to read which path is unfolding.
* The information provided on this website is based solely on my personal experience, research and technical knowledge. This content should not be construed as investment advice or a recommendation. Any investment decision must be made on the basis of your own independent judgement.
Contents