Crypto
26 Jun 2026
Read 12 min
How to Handle bitcoin rainbow chart breach 2026 *
bitcoin rainbow chart breach 2026 helps investors identify undervaluation and adjust portfolio risk.
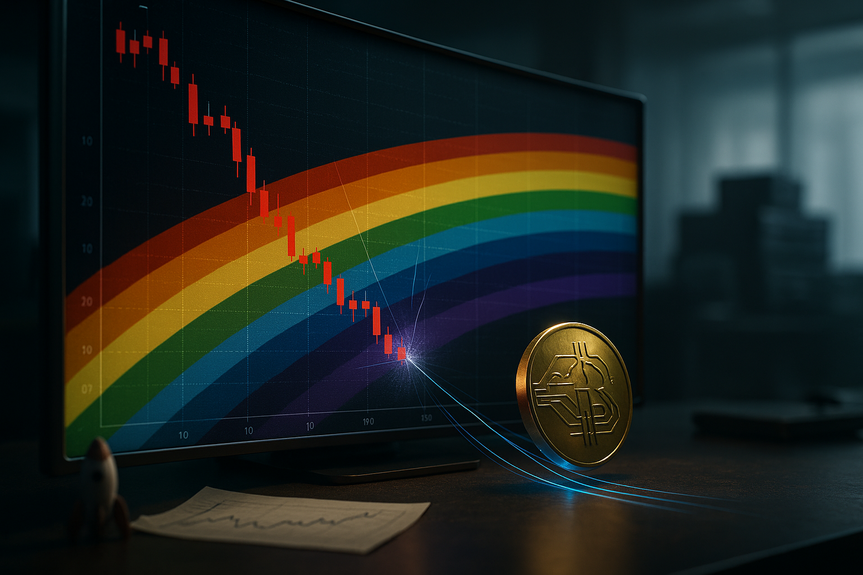
Bitcoin dipped below the Rainbow Chart’s lowest band, landing in the “BTC is dead” zone. The bitcoin rainbow chart breach 2026 signals extreme fear, not a guaranteed collapse. Here’s what it likely means, why models can fail as markets mature, and how to act with clear rules on entries, risk, and signals to watch.
Bitcoin’s 50% slide from its 2025 peak has shaken confidence. The price now sits under the Rainbow Chart’s “floor,” a rare spot last seen near the 2022 bottom. Some traders see value. Others say the chart is broken. The truth sits in the middle: the model can still frame sentiment, but it cannot predict price. This guide explains how to read the move and build a plan around it.
Net inflows or outflows from spot bitcoin ETFs
Large redemptions can pressure price; steady inflows can firm floors
– Derivatives heat
Funding rates: Negative can show fear and short bias; extreme negatives can precede squeezes
Open interest: High and rising into a downtrend can set up a flush
Liquidations: Big washouts often mark near-term reversals
– On-chain health
Realized price and MVRV: Moves near or under realized price often signal value zones
SOPR near 1: Breaks below show capitulation; sustained recovery above can confirm trend shifts
Long-term holder supply: Rising supply held for 155+ days supports the long-term floor
– Miners and security
Hash rate and difficulty trends: Stable or rising is healthy
Miner balances: Rising sell pressure can weigh on price; stability helps
– Macro backdrop
Rates and liquidity: Easing helps risk assets; tightening hurts
Dollar strength (DXY): A strong dollar often pressures bitcoin
Treat these like dashboard lights. The more flash red, the more careful you should be.
What the bitcoin rainbow chart breach 2026 signals (and what it doesn’t)
The Rainbow Chart is a simple, funny way to look at bitcoin’s long-term path. It uses a log curve and color bands to show hot or cold sentiment zones. It is not a crystal ball. The purple “Bitcoin is dead” zone has always been a sentiment tag, not a forecast. Today’s drop under the bottom band reflects two things: – Sentiment is very weak. People are scared. – The market is different. ETFs, large funds, and macro shifts can push price outside old fits. Bitcoin also reached a record near $126,000 in October 2025 without hitting the chart’s highest “overheated” bands. That was a red flag for the model. Other famous models, like Stock-to-Flow, missed the post-2024 halving path too. When big players and ETF flows set the marginal price, neat four-year patterns often fade. Volatility can cool. Cycles can stretch. Charts built on past retail-driven swings lose punch. So what does the breach mean? It is a loud sentiment alarm. It can mark value areas. But on its own, it cannot time a bottom or promise a bounce. Use it as a mood map, not a map of the road ahead.A simple decision framework for today’s market
Start with your time horizon
– Long-term investor (3–5+ years): Focus on thesis and position size. Price bands are noise. Plan buys over time. – Medium-term trader (3–12 months): Respect trend and risk. Use levels and rules. – Short-term trader (days–weeks): Manage leverage and liquidity. Trade setups, not stories.Define levels and invalidation
The market may test lower if risk stays weak. A dip toward the low $50,000s is possible if macro worsens or ETF outflows rise. Build a plan with: – A maximum drawdown you can accept on any new buy. – A clear invalidation level where your idea is wrong. – Position sizes that fit your net worth and stress level.Choose an entry tactic
– Dollar-cost averaging (DCA): Split buys across weeks. This removes guesswork. – Laddered bids: Place staggered limit orders (for example every $2,000–$3,000 lower) to catch wicks. – One-shot buys: If confidence is high, set a stop or hedge to limit risk. If price snaps back above the chart’s floor and holds, consider adding on strength. If it slips toward prior support, let bids fill rather than chasing red candles.Consider basic hedges
– Protective puts: Buy puts to cap downside on spot holdings. – Covered calls: Sell calls against long spot to earn premium in chop. – Light futures hedge: Short a small portion to reduce net exposure. Keep leverage low. Know funding rates, margin needs, and liquidation risks before you hedge.Cross-check with key signals
No single data point settles the case. Build a small checklist and score it weekly. – ETF and fund flowsInstitutional flows vs. retail models
ETFs changed the game. Flows in and out of funds set daily demand. This can smooth volatility and stretch cycles. Old models that assume sharp four-year boom-busts may no longer fit. Expect: – Slower, broader uptrends when inflows are steady. – Deeper, shorter shocks when macro hits risk or when redemptions spike. – More “range” trading between large levels as big players wait for value. Plan with scenarios instead of predictions: – Bull case: Price reclaims the Rainbow floor, ETF inflows return, macro eases. Higher lows form. – Base case: Sideways chop between roughly $50,000 and $70,000 as supply rotates and fear cools. – Bear case: A push into the low $50,000s on risk-off, a washout in leverage, then gradual repair. Assign your own odds and adjust size, not your entire thesis, as data comes in.Action steps for investors right now
Make a calm, written plan
– State your goal (growth, hedge, long-term savings). – Set a max portfolio allocation to bitcoin. – Choose your buy method (DCA, ladders). – Define your invalidation and what you will do if it hits.Improve your average cost with rules
– If you believe in the asset long term, keep DCA small but steady. – If you trade swings, buy weakness and trim into strength. Avoid chasing green candles after big pumps.Use smart defense
– Keep an emergency cash buffer separate from trading funds. – Cap leverage to a low multiple or avoid it. – Automate stops or alerts to cut delay and emotion.Upgrade your information diet
– Track ETF flows and derivatives metrics from reputable dashboards. – Follow on-chain weekly reviews, not minute-by-minute noise. – Limit social media doom and euphoria. Extreme headlines spike bad decisions.Mindset that beats models
Models help you think. They should not think for you. The rainbow bands are best used as a mood meter. They can highlight fear and greed. They cannot price in a rate cut, an ETF shock, or a black swan. Stay grounded: – Separate price from value. Volatility is the fee, not a fine. – Judge decisions by process, not by one outcome. – Keep cash for opportunity. Patience is a position.Bottom line on the bitcoin rainbow chart breach 2026
The bitcoin rainbow chart breach 2026 is a sentiment event, not a verdict. It tells you fear is high and past fits are loosening as institutions and ETFs shape the tape. Use it to size risk, not to call tops or bottoms. Build a plan, watch flows and positioning, and execute with steady rules. If your thesis holds, the bitcoin rainbow chart breach 2026 can be a time to improve entries without losing sleep. (Source: https://www.coindesk.com/markets/2026/06/24/bitcoin-just-broke-below-the-floor-of-its-famous-rainbow-chart-into-the-btc-is-dead-zone) For more news: Click HereFAQ
Q: What does the bitcoin rainbow chart breach 2026 indicate about market sentiment?
A: The bitcoin rainbow chart breach 2026 is primarily a loud sentiment alarm that signals extreme fear rather than a guaranteed collapse. Historically the Rainbow Chart’s purple “Bitcoin Is Dead” zone has marked periods of pessimism that were later followed by recoveries, so it functions best as a mood map rather than a timing tool.
Q: Does the “Bitcoin is Dead” zone mean bitcoin is actually finished?
A: No, falling into the “Bitcoin is Dead” zone does not mean bitcoin is finished; analysts in the article note it signals sentiment more than certainty. Historically that band has often marked periods of extreme fear and undervaluation that were later followed by recoveries.
Q: How should long-term investors respond to the bitcoin rainbow chart breach 2026?
A: Long-term investors should focus on their investment thesis and maintain appropriate position sizing, treating price bands as noise after the bitcoin rainbow chart breach 2026. The article recommends planning buys over time, such as through dollar-cost averaging, rather than trying to time a bottom.
Q: What entry tactics are recommended for traders after the Rainbow Chart breach?
A: The article recommends entry tactics like dollar-cost averaging to split buys across time, laddered limit orders to catch lower wicks, or disciplined one-shot buys paired with stops or hedges. Traders are advised to set clear invalidation levels and avoid chasing short-term moves.
Q: What hedging strategies can protect spot holdings amid the breach?
A: Suggested hedges include buying protective puts to cap downside, selling covered calls to earn premium, or shorting a small portion of futures to reduce net exposure. The article also warns to keep leverage low and be mindful of funding rates, margin requirements, and liquidation risks.
Q: Which signals should investors watch to cross-check the Rainbow Chart’s warning?
A: Investors should monitor ETF and fund flows, derivatives metrics such as funding rates, open interest and liquidations, and on-chain indicators like realized price, MVRV, SOPR, and long-term holder supply. They should also watch miner trends (hash rate and miner balances) and macro variables (policy rates and dollar strength), treating these metrics like dashboard lights where more red implies greater caution.
Q: Have ETFs and institutional flows made the Rainbow Chart less reliable after the bitcoin rainbow chart breach 2026?
A: Yes, the article argues that growing ETF flows and institutional participation have altered price discovery, and the bitcoin rainbow chart breach 2026 highlights that models built on past retail-driven cycles can be less reliable as standalone indicators. As big players set the marginal price, volatility can cool and cycles may stretch, so the Rainbow Chart remains a useful sentiment reference but not a precise forecasting tool.
Q: What practical action steps should investors take now following the bitcoin rainbow chart breach 2026?
A: Make a calm, written plan stating your goal, maximum allocation, chosen buy method (DCA or ladders), and clear invalidation levels. Improve average cost with steady DCA or laddered orders, use defensive measures like an emergency cash buffer and capped leverage, and automate alerts or stops to reduce emotional errors. Upgrade your information diet by tracking ETF flows, derivatives and weekly on-chain reviews while avoiding minute-by-minute social media noise.
* The information provided on this website is based solely on my personal experience, research and technical knowledge. This content should not be construed as investment advice or a recommendation. Any investment decision must be made on the basis of your own independent judgement.
Contents