Crypto
28 Jan 2026
Read 11 min
XRP outlook after sell-off: How to spot a rebound *
XRP outlook after sell-off reveals a timely buying window as volume surges and a $1.80 base forms.
XRP outlook after sell-off: A sharp volume surge, a retest of $1.80 support, and a negative MVRV reading set the stage for a potential rebound. Watch for follow-through buying after the 214% volume jump, stabilization in ETF flows, and signals from the Fed meeting to confirm momentum.
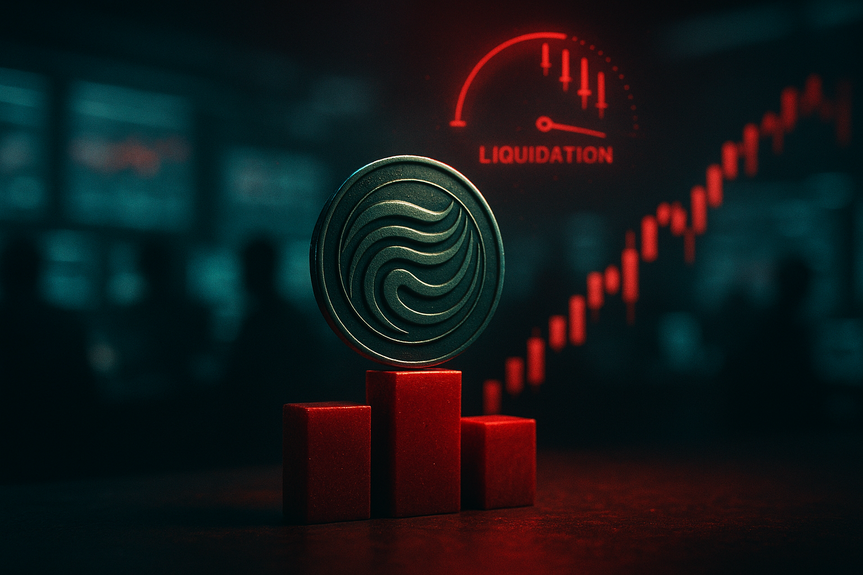
The crypto market fell hard, with $745 million in liquidations in 24 hours. XRP briefly touched $1.80–$1.83 over the weekend and hovered near $1.88 on Monday. Volume spiked 214% to $3.34 billion, even as sentiment stayed weak. This mix of fear and activity puts XRP into focus. For anyone tracking the XRP outlook after sell-off conditions, the next moves may depend on whether buyers defend $1.80 and if macro news calms the market.
Higher lows on price as volume stays elevated
Green candles with strong closes near intraday highs
A shift from reactive selling to proactive bids on dips
If volume fades and price drifts lower, the surge was likely forced selling, not accumulation.
Repeated defense of $1.80 without deeper wicks
Higher lows on 4-hour and daily charts
A clean break above near-term resistance (see levels below)
A firm close below $1.80 would weaken the pattern and open room for further downside.
$1.80: The key battlefield. Multiple tests make it important. A strong defense improves odds of a constructive base.
$1.83–$1.85: Intraday pivot zone. Holding above here helps bulls gain control in shorter time frames.
$1.92–$1.95: First test area where recent rebounds stalled. A close above shows strength.
$2.00: Big round number and psychological cap. Clearing and holding it can invite momentum buyers.
$2.05–$2.10: Follow-through zone. Success here would confirm that the base is real and not just a bounce.
Price holds $1.80, forms higher lows.
Volume stays healthy on green days and fades on red days.
ETF flows stabilize; Fed tone is steady.
Break above $1.95 and $2.00 triggers measured continuation.
Price chops between $1.80 and $1.95.
Volume cools as traders wait for macro clarity.
False breakouts are common; patience is key.
Clean daily close below $1.80 on rising volume.
ETF outflows deepen; macro turns risk-off.
Sellers control the tape; bulls step back until a fresh base forms.
Confirmation: Higher highs and higher lows across 4-hour and daily charts
Dead-cat bounce: Sharp spike that fails at resistance, followed by lower lows
Confirmation: Rising buy volume on advances, lighter sell volume on pullbacks
Dead-cat bounce: Big volume on the first spike, then quick fade
Confirmation: Strength across large-cap coins and improved derivatives funding
Dead-cat bounce: XRP pops alone while the broader market stays weak
Confirmation: ETF outflows slow or flip; futures funding normalizes
Dead-cat bounce: Outflows continue; funding stays skewed and unstable
Respect the $1.80 level. Plan around it instead of guessing.
Use clear invalidation points. If price breaks your line, step aside.
Size positions modestly. Volatility cuts both ways.
Wait for a daily close to confirm levels.
Let volatility work for you by buying strength after confirmation, not hope.
Fed press conference tone
Major earnings and guidance
ETF flow updates
Market-wide liquidation and funding trends
Key drivers behind the slide
Market-wide liquidations
Heavy liquidations added stress across crypto. When leverage unwinds fast, prices drop quickly. This drives stop-loss cascades and forces more selling. XRP fell with the pack, even though the network itself did not change.Thin weekend trading
Weekend liquidity can be low. Big orders move price more than usual. XRP’s dip to $1.80 came during this thin period, which likely magnified the drop and the bounce attempts that followed.Macro uncertainty: The Fed and earnings
The Federal Reserve starts a two-day meeting this week. After three straight quarter-point cuts, the market expects a pause. But traders care most about the press conference tone. A hint of a slower or faster path can sway risk assets. Tech earnings add another layer. If guidance is soft, risk sentiment can weaken, and that could weigh on XRP again.ETF outflows and profit-taking
Spot XRP ETFs saw about $40.6 million in weekly outflows. This looks like profit-taking after the early-year rally. Large players locking in gains can pressure price short term. But flows can flip quickly if conditions improve.XRP outlook after sell-off: indicators that matter
Volume surge: 214% in 24 hours
A sudden volume spike during a sell-off can mean two things. It can mark panic, or it can show strong hands absorbing supply. The 214% jump to $3.34 billion says many participants were active at current prices. To read it as bullish, look for:MVRV turns negative
The MVRV ratio for XRP sits around -5.7%. When MVRV drops below zero, the average holder is at a loss. That often reduces selling pressure. It also attracts bargain hunters. While no single metric guarantees a rebound, a negative MVRV supports a constructive read for the XRP outlook after sell-off phases, especially if it aligns with stable support.Support near $1.80: triple bottom in play
XRP has tested the $1.80 area several times. Each test brought in buyers, but rebounds have been modest. A triple bottom is only confirmed if price breaks above the recent swing highs on stronger volume. Key signs to watch:ETF flows as a sentiment gauge
ETF outflows point to institutions stepping aside. If weekly flows stabilize or turn positive, it can signal improving confidence. For near-term momentum, flat to positive flows are more supportive of a rebound than continued outflows.Macro calendar: FOMC and earnings
The Fed’s tone can lift or cap risk assets. A steady stance with balanced language may help crypto stabilize. A hawkish surprise or cautious corporate guidance could keep buyers on the sidelines. For the XRP outlook after sell-off conditions, macro clarity often acts as the catalyst for confirmation.Actionable levels and scenarios
Support
Resistance
Rebound scenario
Range scenario
Breakdown scenario
How to spot confirmation versus a dead-cat bounce
Price structure
Volume behavior
Market breadth
Flows and funding
Risk management in choppy conditions
Keep it simple
Avoid overtrading
Track catalysts
What could invalidate a rebound
Loss of key support
A decisive move below $1.80 with strong volume would damage the bullish case. It would show that the base failed and that sellers remain in control.Persistent outflows
If ETF outflows accelerate, it signals ongoing profit-taking or reduced institutional interest. That would weigh on the XRP outlook after sell-off conditions.Hawkish macro shift
A surprisingly strict Fed tone, weaker guidance from top tech names, or another spike in liquidations could keep risk sentiment fragile and delay any recovery.Bottom line
A 214% jump in volume, a defended $1.80 area, and a negative MVRV reading create a constructive setup, but confirmation is still needed. Watch price behavior around $1.95–$2.00, ETF flow trends, and the Fed’s message. With clear levels and patience, the XRP outlook after sell-off conditions can turn favorable once buyers prove control. This article is for information only and is not financial advice. (Source: https://u.today/xrp-rockets-214-in-volume-as-market-sell-off-liquidates-745-million) For more news: Click HereFAQ
Q: What caused XRP’s recent decline during the market sell-off?
A: The decline coincided with $745 million in market-wide liquidations and thin weekend trading that magnified moves down to the $1.80–$1.83 area. Additional pressure came from about $40.6 million in weekly spot ETF outflows and macro uncertainty around the Fed meeting and tech earnings.
Q: How large was the recent volume surge in XRP and what could it indicate?
A: XRP trading volume jumped 214% to $3.34 billion, indicating heavy activity at current prices. Such a surge can represent panic selling or buyers absorbing supply, and it becomes bullish only with follow-through buying, higher lows and strong closes near intraday highs.
Q: What does the negative MVRV tell us about XRP’s current state?
A: The MVRV for XRP sits around -5.7%, which means the average holder is currently at a loss. That dynamic often reduces immediate selling pressure and can attract bargain hunters, supporting a constructive XRP outlook after sell-off.
Q: Is the $1.80 level a reliable support for XRP right now?
A: XRP has tested the $1.80 area multiple times and is forming what analysts describe as a triple bottom, which has drawn buyers on each test. However, the support is only confirmed if price builds higher lows and breaks recent swing highs, while a decisive daily close below $1.80 would weaken the bullish case.
Q: How have ETF flows affected XRP’s price action this week?
A: Spot XRP ETFs recorded about $40.6 million in weekly outflows, which appears to reflect institutional profit‑taking after the early-year rally. If flows stabilize or reverse, that would support a rebound, while continued outflows would weaken the XRP outlook after sell-off.
Q: Which macro events should traders monitor that could influence XRP’s momentum?
A: Traders should watch the Federal Reserve’s two-day FOMC meeting and Chairman Jerome Powell’s post-meeting press conference, as the Fed is expected to pause after three consecutive quarter-point cuts. Major technology earnings also matter, since cautious guidance or a hawkish tone could keep risk sentiment fragile and weigh on XRP momentum.
Q: What technical and volume signals would confirm a genuine XRP rebound versus a dead‑cat bounce?
A: Confirmation would show higher highs and higher lows on 4‑hour and daily charts, rising buy volume on advances with lighter sell volume on pullbacks, and improving market breadth and ETF flows. A dead‑cat bounce would instead feature a sharp spike that fails at resistance, fading volume, and continued outflows or weak breadth.
Q: Which price levels should traders use for risk management around the current XRP range?
A: Key levels to watch are support at $1.80 with $1.83–$1.85 as an intraday pivot, while resistance sits at $1.92–$1.95, $2.00 and $2.05–$2.10. A sustained close above $1.95–$2.00 would favor a measured rebound and invite momentum buyers, while a clean daily close below $1.80 on rising volume would indicate a breakdown.
* The information provided on this website is based solely on my personal experience, research and technical knowledge. This content should not be construed as investment advice or a recommendation. Any investment decision must be made on the basis of your own independent judgement.
Contents