Crypto
27 Apr 2026
Read 12 min
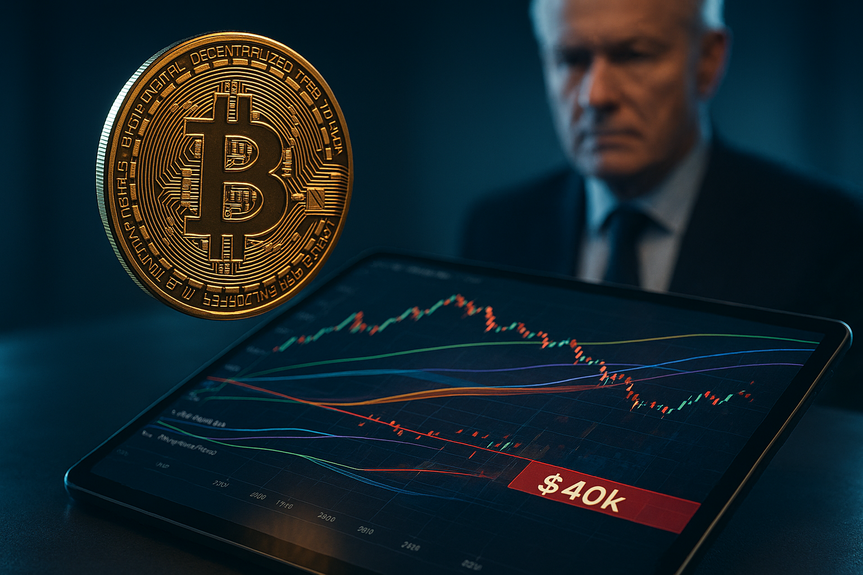
Bitcoin $40k probability: How to read the rare odds *
Bitcoin $40k probability explains why analysts call outcome near-unprecedented and helps gauge risk.
Analyst James Check says the Bitcoin $40k probability is very low. His Mean Reversion Index places a $40,000 close in the 0.4th percentile of all days. That would be an almost unheard-of slide versus long-term anchors like the 200-week average and realized price. Here is what that means and how to use it.
Bitcoin has bounced about 15% this month and traded near $78,000 at last check. But many traders still argue about the trend. The coin sits roughly 40% below its record, even after a strong recovery from the February low near $60,000. Some forecasters warn it could fall to $40,000. Analyst James Check pushes back. He says such a drop would be rare when you measure price against long-term guides, not just against past highs.
What the data says about Bitcoin $40k probability
The Mean Reversion Index in plain English
Mean reversion is the idea that price wanders but often returns toward fair value over time. Check’s Bitcoin Mean Reversion Index sets a fair-value zone by averaging several “anchors.” These anchors mix on-chain signals and classic technical levels. Then the model ranks today’s price on a percentile scale across Bitcoin’s full price history. A $40,000 reading scores as a “Q 0.4 event.” That means only 0.4% of all daily closes in history were as weak or weaker relative to those anchors. In short, it would be a once-in-several-hundred-days type of close, and one that sits below almost every major baseline. By contrast, the model currently places price around the 31.5th percentile. That is soft but still inside a normal correction range.The anchors behind the score
The index blends about nine key anchors so one metric cannot skew the outcome. The set includes:- The 200-week moving average (a long-term trend floor many watch)
- Realized price (on-chain average holder cost basis)
- A power-law trend that maps long-run adoption and growth
- Multiple volume-weighted average price baselines from major cycle pivots
- Faster and slower trend gauges to reflect momentum and value
How to read percentiles, not just prices
Price levels can mislead without context
Price alone does not tell you if a move is extreme. A drop to $40,000 might sound like “only” a return to prior support. But the index says this move would push the coin under most historical baselines at once. That is why the percentile is so low.Percentiles convert history into odds
A percentile is a position on a 0–100 scale within past outcomes. If current price sits near the 31.5th percentile, history shows we have seen weaker conditions often. If price fell to the 0.4th percentile, it would sit in a zone seen less than 1% of the time. This does not make it impossible; markets can do anything. It does tell you the move would buck nearly all long-term anchors. When you judge the Bitcoin $40k probability, think in percentiles, not emotions. If the odds are tiny, you treat the scenario as a stress test, not a base case.Why “near-unprecedented” matters for risk
Anchors reflect many investor tribes
Each anchor echoes a group of market players:- Long-term trend followers track the 200-week average.
- On-chain holders watch realized price to gauge pain or gain.
- Quants fit power-law curves to growth and adoption.
- Traders use VWAPs from key cycle dates for fair value zones.
It also frames time horizons
Mean reversion is not a day-trader tool. It shines across months to years. If the model says $40,000 is an outlier, it means you would likely need a major shock and sustained pressure to get there and stay there. Quick wicks can happen, but daily closes that deep are hard to hold without fresh, heavy selling.Could $40,000 still happen? Key stress scenarios
Low probability is not zero. Here are paths that could force a deeper slide:- Macro shock: A sharp recession, a credit event, or surging real yields could drain risk appetite and force broad de-risking.
- ETF outflows: If large spot ETF holders sell into weakness, it could pull price below fair value anchors and keep it there.
- Regulatory hit: A surprise ban, lawsuit, or bank hurdle could raise friction for capital flows and spark panic.
- Miner stress: If price falls while fees drop, weak miners could capitulate and add supply to the market.
- Liquidity air pocket: Thin order books during off-hours can amplify moves, especially if leverage is high.
- Narrative break: If growth stories stall, new buyers may pause while old buyers trim exposure.
Practical ways to use these odds in your plan
Set ranges, not single targets
Trade plans work better with ranges. Mark the long-term anchors on your chart. Note where price sits on the percentile curve. If the model shows we are in the 20th–40th percentile, that is a normal correction zone. Size positions to handle swings in that band without stress.Position size and cash buffers
If you are not sure about direction, trade smaller. Keep a cash buffer for rare dips. You do not need to predict exact lows to benefit. Buying in steps near major anchors can improve average cost while limiting regret.Watch what could change the odds
Track signals that can move the percentile:- ETF net flows turning negative or positive for several weeks
- Funding rates and open interest rising too fast (fragile leverage)
- Miner balances and revenue stress
- Realized price bands and whether spot trades below them
- Macro data that changes real yields, the dollar, and liquidity
Use alerts around anchors
Set alerts a bit above and below each anchor. If price reclaims an anchor after a dip, that is often a constructive sign. If it rejects at multiple anchors in a row, tighten risk.Respect time in the market
Mean reversion is patient. If you invest with a multi-year view, percentiles are a helpful map. They tell you when price is stretched and when value is improving. Timing every swing is hard. Let the model guide your bias rather than rule your every trade.Context: today’s strength versus history
Bitcoin rallied from a February low near $60,000 to about $78,000, gaining close to 15% this month. Even so, it remains well below its recent record near $126,000. That mix—strong rebound, yet under prior highs—often breeds debate. The percentile view cuts through that noise. Around the 31.5th percentile, price looks weak relative to anchors but not broken. In that frame, a standard pullback is possible, and a full reset to $40,000 would be a stretch.Bottom line: Bitcoin $40k probability and your next move
The model-based read is clear: the Bitcoin $40k probability is small, not zero. A $40,000 daily close would land in the 0.4th percentile of history across key anchors. That would take a rare, heavy mix of shocks. Use this not to dismiss risk, but to size it. Frame plans around ranges and anchors, keep cash for surprises, and watch the signals that would raise or lower the odds. If conditions improve, treat deep tails as stress tests. If several risks align, adapt fast. Either way, let percentiles, not fear, guide your next step. This article is for information only and is not financial advice. (Source: https://www.coindesk.com/markets/2026/04/25/bitcoin-at-usd40-000-would-be-near-unprecedented-statistical-outcome-analyst-says) For more news: Click HereFAQ
Q: What did analyst James Check say about the Bitcoin $40k probability?
A: Analyst James Check says the Bitcoin $40k probability is very low, calling a $40,000 daily close a “Q 0.4” or 0.4th percentile event on his Mean Reversion Index. He said such a move would be statistically extraordinary and “near-unprecedented” relative to long-term anchors.
Q: How does the Bitcoin Mean Reversion Index measure the Bitcoin $40k probability?
A: The index averages about nine anchors — a mix of technical, on-chain, trend, fast and slow measures — to set a fair-value zone and then ranks today’s price on a historical percentile scale. It converts a prospective $40,000 close into a percentile, which for $40,000 scores as a Q 0.4 or the 0.4th percentile.
Q: What key anchors are included in the Mean Reversion Index?
A: The index blends around nine anchors, including the 200-week moving average, realized price, a power-law trend, multiple volume-weighted average price baselines from major cycle pivots, and faster and slower trend gauges. Because it is composite, it reduces noise from any single input.
Q: What does a “Q 0.4” or 0.4th percentile reading mean in practical terms?
A: A Q 0.4 reading means only 0.4% of all historical daily closes were as weak or weaker relative to the anchors, effectively placing such a close below almost every major baseline. In practical terms this implies a very small Bitcoin $40k probability and is described as a once-in-several-hundred-days type of close.
Q: Could Bitcoin still fall to $40,000 despite the low model odds?
A: Low probability is not zero, and the article lists stress scenarios that could force a deeper slide, such as a sharp macro shock, large ETF outflows, a regulatory hit, miner capitulation, liquidity air pockets, or a narrative break. Even so, the index warns a $40,000 daily close would be a stretch and would likely require several of those forces to hit at once.
Q: How should investors use the Bitcoin $40k probability in their trading or investing plans?
A: Use the percentile view to set ranges instead of single targets: mark long-term anchors, size positions to handle swings, and keep cash buffers for rare dips. Treat the Bitcoin $40k probability as a stress test rather than a base case, and let percentiles guide your bias over months and years.
Q: What specific signals can change the Bitcoin $40k probability in the index?
A: Track ETF net flows, funding rates and open interest, miner balances and revenue, realized price bands and whether spot trades below them, and macro data that changes real yields, the dollar, and liquidity. If several of these signals worsen together, the model says the tail risk and the Bitcoin $40k probability would rise.
Q: Where does Bitcoin sit in the index today and what does that mean for risk?
A: The model currently places price around the 31.5th percentile after a roughly 15% monthly gain and trading near $78,000, which is historically weak but within normal correction ranges. That means standard pullbacks are possible while a full reset to $40,000 would be considered unlikely by the index.
* The information provided on this website is based solely on my personal experience, research and technical knowledge. This content should not be construed as investment advice or a recommendation. Any investment decision must be made on the basis of your own independent judgement.
Contents