Crypto
07 Oct 2026
Read 13 min
How bitcoin long liquidations work and how to avoid wipeouts *
how bitcoin long liquidations work to help you spot forced-selling triggers and protect your positions
Learn how bitcoin long liquidations work and how to steer clear of forced exits. When price drops fast, exchanges sell leveraged longs to repay loans. One hour recently erased over $400 million. Know triggers, warning signs, and simple rules to protect capital before the cascade hits.
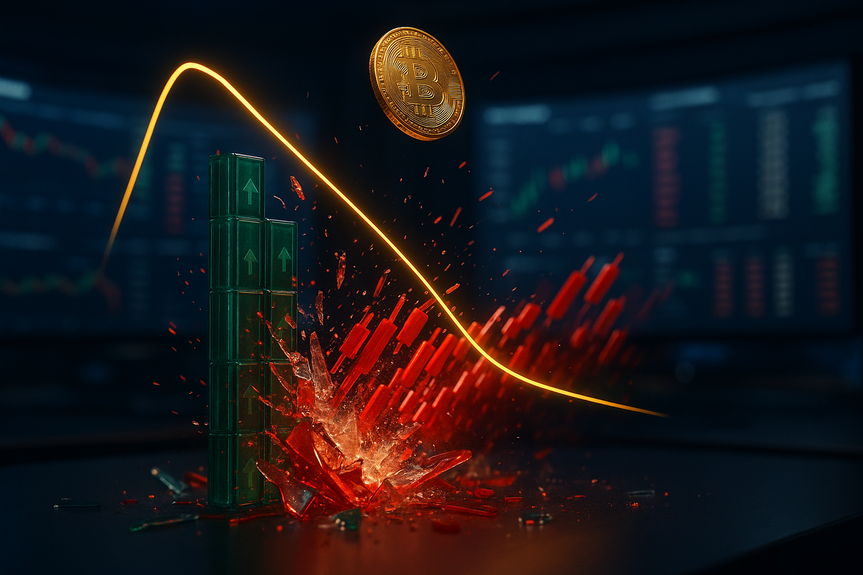
A sharp slide pushed Bitcoin near $83,800 and forced exchanges to liquidate about $403.6 million in long positions within a single hour. That was roughly 0.27% of all open interest. Longs made up 97% of the $415 million flushed during that burst. The event shows why learning how bitcoin long liquidations work can save your account when markets whip.
Across the full 24 hours, liquidations reached about $555 million, with $487 million from longs. Most of the damage came in the final hour of a four-hour window. Ethereum longs took a larger hit than Bitcoin in dollar terms, hinting at sharper ETH losses, higher leverage, or both. Even so, open interest sat near $150 billion afterward, down only 2.45%, which means many leveraged trades still stood. With that much fuel left, another quick burst is always possible. Spot buyers, who face no forced selling, may steady price, but the risk remains.
How bitcoin long liquidations work
Margin and leverage in plain words
You put down collateral, called margin, to borrow buying power. If you use 5x leverage, $1,000 controls $5,000 of Bitcoin. You win or lose on the full $5,000. Leverage makes gains bigger, but it also makes losses faster.Maintenance margin and the liquidation price
Exchanges set a maintenance margin. If your equity (your margin plus profit or loss) drops below that level, the exchange steps in. It uses a mark price, not just the last trade, to judge where the market is. Your liquidation price moves with your leverage, entry, fees, and funding. Higher leverage brings the liquidation price closer to your entry.What the liquidation engine does
When the mark price hits your liquidation threshold, the exchange starts closing your position to protect its loan. It may:- Sell part of your position (partial liquidation) to cut risk.
- Close your whole position (full liquidation) if losses grow.
- Tap an insurance fund if the market gaps through your stop range.
- Use auto-deleveraging (ADL) in thin markets to pass risk to opposing traders.
Open interest and one-sided risk
Open interest is the value of all active futures. It rises when new contracts open and falls when they close. If a lot of that OI sits in longs and price dips, many traders share similar liquidation levels. That cluster can turn a normal move into a cascade.Why one hour can erase hundreds of millions
In the recent drop, data trackers saw almost all the four-hour liquidations land in the final hour. That is a classic sign of crowded positioning. Once price pokes below a key zone, it knocks out one band of longs. The forced selling pushes price lower, which hits the next band, and so on. Because liquidations are market sells, not limit orders, they can move price more than normal trading. Key numbers from the move:- About $403.6 million in long liquidations hit in one hour, roughly 0.27% of total open interest.
- Longs were 97% of all liquidations during that burst.
- Roughly 98% of the four-hour long liquidations arrived in the last hour.
- Across 24 hours, $487 million of $555 million in liquidations were longs, with about 83% of the day’s long total in that single hour.
- ETH long liquidations (~$155 million) topped BTC (~$116 million), despite BTC’s larger market.
- Open interest stood near $150.24 billion after the drop, down 2.45% as prices fell.
- Wallets holding 100–1,000 BTC added about 113,950 BTC from mid-July to late September, a sign of steady spot accumulation.
Signals to watch before a wipeout
Rising open interest with flat or slow price
If OI climbs while price stalls, traders may be adding leverage on both sides. If funding and sentiment skew long, the crowd is likely leaning the same way. That sets up a squeeze.High positive funding and long skew
When funding rates are rich and most traders pay to stay long, the market invites short sellers and makes longs fragile. A small dip can snowball into liquidations.Thin order books and off-hours trading
Weekends, holidays, and late hours can bring lower liquidity. Thin books mean forced sells slide price faster. A modest sell turns into a bigger drop.Macro events on the calendar
Rate decisions, CPI prints, jobs data, ETF flows, and large unlocks can swing price. Do not carry max leverage into those windows without a plan.Liquidation heatmaps and clusters
Tools that map estimated liquidation levels help. Big clusters below price are magnets. When price tags the first cluster, the chain can begin.Practical rules to avoid wipeouts
Keep leverage low
Most traders lose with high leverage. A 3x to 5x cap keeps liquidation prices farther away. The best defense is not to place your stop where the crowd does.Size positions with a fixed risk
Pick a dollar risk per trade, like 1% of your account. Work backward to set size and stop. Do not change your plan mid-trade to “save” a loser.Use isolated margin, not cross
Cross margin puts your whole account at risk to defend one position. Isolated margin limits the damage to that single trade.Place hard stops and consider soft exits
Put a stop-loss where your trade idea is wrong, not at your liquidation price. In fast moves, the market fills stops better than it fills liquidations. Add an alert to cut size early if momentum turns.Scale entries and exits
Avoid entering full size at one price. Ladder into positions and take profits in steps. If the move fails, your average entry is better and your risk is smaller.Watch funding, OI, and basis
When funding is very positive, OI is rising, and the futures premium runs hot, reduce longs or hedge. When funding flips negative and weak hands exit, consider adding with caution.Avoid adding to losers
Do not “martingale” down. Adding size to a falling long pulls your liquidation price up toward spot. One more red candle can then wipe the account.Hedge when needed
Protect a large long with a small short on another venue, or buy puts to cap your downside. Options cost money, but they cap risk during events.Prefer spot for core holdings
Spot coins have no forced sellers. If you believe the long-term case, keep core exposure in spot and use small, time-bound leverage for trades.A simple toolkit you can use today
- CoinGlass or similar: track open interest, funding, and liquidation heatmaps.
- Exchange stats: see maker/taker volume and order book depth. Thin depth equals faster moves.
- On-chain wallets: watch large holder accumulation or distribution for context.
- Economic calendar: note high-impact events and reduce leverage before they hit.
- Pre-trade checklist: entry, invalidation level, stop, size, take-profit, and max daily loss.
- Journal: log setups, emotions, and outcomes to spot patterns that lead to mistakes.
(Source: https://finance.yahoo.com/markets/crypto/articles/bitcoin-slide-wipes-over-400-025046176.html)
For more news: Click Here
FAQ
Q: What triggers a long liquidation on crypto exchanges?
A: A long liquidation is triggered when a trader’s equity falls below the exchange’s maintenance margin and the exchange’s mark price reaches the trader’s liquidation price, forcing the platform to close the position to repay borrowed funds. Learning how bitcoin long liquidations work requires noting that exchanges use a mark price (not just the last trade) and can perform partial or full liquidations, tap insurance funds, or invoke auto-deleveraging in fast moves.
Q: How did the recent Bitcoin slide erase over $400 million in longs so quickly?
A: The rapid drop toward about $83,800 forced exchanges to liquidate roughly $403.58 million in leveraged long positions within one hour, equal to about 0.27% of open interest. Longs were 97% of the $415.33 million flushed, and CoinGlass logged 98% of the $412.99 million in four-hour long liquidations inside that final hour, which points to crowded positioning.
Q: What is open interest and how does it affect liquidation risk?
A: Open interest is the dollar value of all active futures contracts and it rises when new contracts open and falls when contracts close. Because OI is dollar-denominated, falling prices can reduce it, but if a large share of OI is concentrated in longs a price dip can hit many similar liquidation levels and trigger a cascade; after the drop OI stood near $150.24 billion, down 2.45%.
Q: What practical rules can traders follow to avoid wipeouts?
A: Keep leverage low (the article suggests a 3x–5x cap), size positions to a fixed dollar risk (for example 1% of the account), use isolated margin, and place stops at your trade invalidation rather than at the liquidation price. Also scale entries and exits, avoid adding to losers, consider hedges or options for downside protection, and prefer spot for core holdings to eliminate forced selling risk.
Q: Which market signals often precede a liquidation cascade?
A: Watch for rising open interest while price stalls, high positive funding rates and a long-skewed market, and thin order books or off-hours liquidity, since each condition makes forced sells move price faster. Also monitor macro events like rate decisions or ETF flows and use liquidation heatmaps to spot clusters of nearby stops that can act as magnets.
Q: How do exchanges execute liquidations during fast price drops?
A: When the mark price hits liquidation thresholds the exchange’s liquidation engine will sell at market to get flat, which can be a partial or full close of the position. If the market gaps through stops the exchange may use an insurance fund or auto-deleveraging to cover losses, and these actions occur without waiting for the trader to act.
Q: Why did Ethereum longs take a larger dollar hit than Bitcoin in this event?
A: Ethereum longs accounted for about $155.12 million of the liquidations versus roughly $115.73 million for Bitcoin, despite Bitcoin’s larger market size. That difference may reflect sharper ETH losses over the period, heavier leverage on ETH positions, or both.
Q: What tools can traders use to monitor and reduce liquidation risk?
A: Use trackers like CoinGlass to follow open interest, funding and liquidation heatmaps, check exchange order book depth and maker/taker stats, and monitor on-chain wallet accumulation for context. Pair those data tools with an economic calendar, a pre-trade checklist (entry, invalidation, stop, size, take-profit), and a trading journal to enforce risk rules.
* The information provided on this website is based solely on my personal experience, research and technical knowledge. This content should not be construed as investment advice or a recommendation. Any investment decision must be made on the basis of your own independent judgement.
Contents